What 5,700 Verification Comments Taught Me About Where EPDs Actually Go Wrong
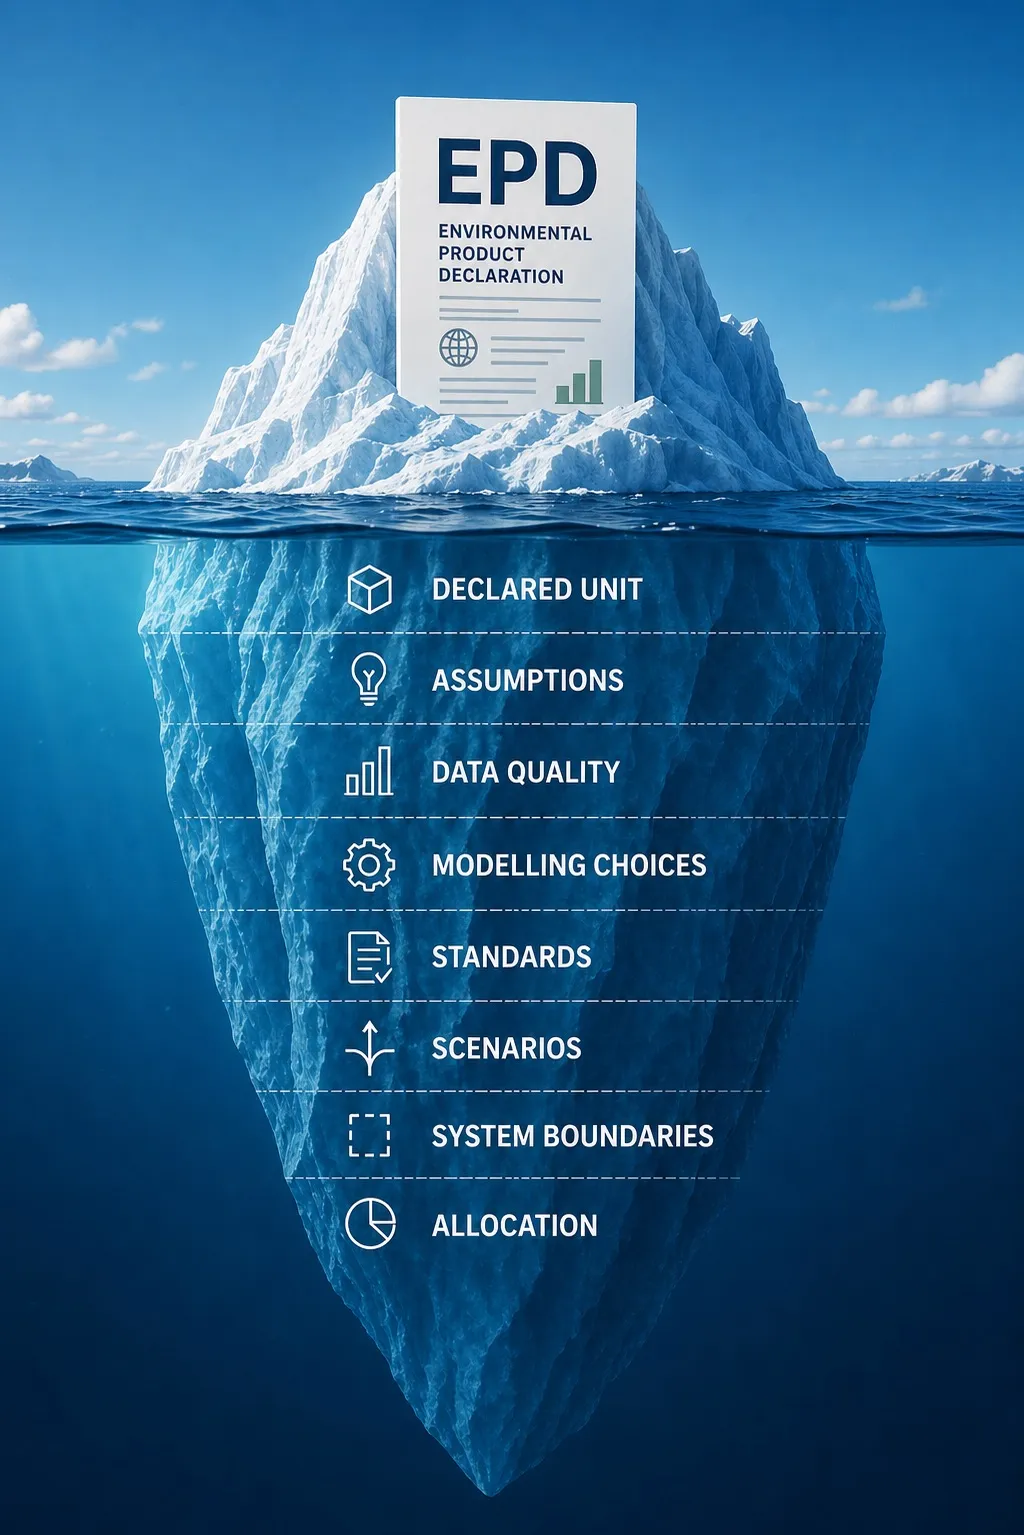
I’ve been verifying EPDs for six years. A few months ago, I did something I’d been meaning to do for a while: I went back through every EPD verification comment I’ve ever written and categorised them all by theme.
The total came to a beautiful round number: 5,700 comments, across 169 EPD projects, four programme operators, EN 15804+A2 and ISO 21930, from 2020 to 2026.
I expected the data to confirm what most people assume about EPD problems. It didn’t.
The finding I didn’t expect
Ask anyone what goes wrong in EPDs and they’ll say modelling errors. Wrong calculations. Bad data.
Those exist. But they’re not the biggest category. Not even close.
The single largest theme, at 18.8% of all my comments, was incomplete or ambiguous documentation. Transparency gaps. Things that should be documented but aren’t. Almost one in five of every comment I’ve written in six years was, in essence: I can’t verify this because you haven’t told me enough.
Add the related transparency theme of LCI data sources, database versions and data quality assessment (4.5%), and documentation gaps alone outweigh any single modelling issue.
The full picture
The top 10 themes account for 70% of all classified findings:
| # | Theme | Share |
|---|---|---|
| 1 | Incomplete or ambiguous background report / EPD documentation | 18.8% |
| 2 | Environmental impact results tables – errors and omissions | 9.1% |
| 3 | System boundary definitions and life cycle module declarations (A1–D) | 8.7% |
| 4 | LCIA indicator calculation errors and missing impact categories | 8.6% |
| 5 | End-of-life scenarios and waste category reporting (C1–C4) | 5.0% |
| 6 | LCI data sources, database versions and data quality assessment | 4.5% |
| 7 | PCR/cPCR reference accuracy and compliance | 4.4% |
| 8 | Electricity mix selection and energy modelling parameters | 4.3% |
| 9 | Life cycle scenarios and technical assumptions (A4–C4) | 4.0% |
| 10 | Transport distances, modes and fuel parameters (A2, A4) | 2.9% |
Another 14 themes — biogenic carbon, allocation, cut-off, product description and more — make up the remaining 30%.
One more split worth noting: 59% of comments landed on the background report, 41% on the EPD document itself. The public-facing document gets most of the attention. The background report generates most of the findings.
Why transparency gaps dominate
I think there’s a simple reason. Modelling requires expertise, so people concentrate on it. Documentation feels like admin, so it gets done last, under deadline pressure, by whoever has time.
But verification runs on documentation. A verifier can’t confirm a system boundary that isn’t described, or accept a dataset whose version isn’t stated. When the documentation is thin, the verifier has to ask. Every question is a comment, a response, a revision round. Most of the back-and-forth in verification isn’t about whether the LCA is right — it’s about establishing what was actually done.
The frustrating part: these are the cheapest issues to prevent. A calculation error takes real effort to find and fix. A missing database version takes one sentence.
What this means if you develop EPDs
Three practical takeaways from the data.
Treat the background report as the primary deliverable, not an attachment. It generates six of every ten verification comments. Before submitting, read it as a stranger would: could someone reproduce your study from this document alone? If a choice was made — allocation, cut-off, electricity mix, scenario assumptions — is the choice and its justification written down?
Check completeness before correctness. Results tables with errors and omissions (9.1%) and module declaration issues (8.7%) rank second and third. These are largely mechanical: every declared module present, every required indicator reported, units consistent, no orphaned values. This is checklist work, and it’s worth doing systematically rather than trusting that the export was clean.
Write down the boring metadata. Database names and versions, software versions, dataset reference years, data quality assessment. Nobody enjoys this section. It’s also one of the most commented-on themes in six years of my verification work.
None of this requires deeper LCA expertise. It requires treating verification readiness as its own task, done before submission rather than discovered during it.
Where this went
Those six years of comments shaped how I understand where EPDs go wrong — and that understanding is exactly what’s built into Lodestellar now. The patterns above aren’t hypotheses; they’re the accumulated record of what verifiers actually flag.
To fellow verifiers: have you ever looked back at your own comments like this? I’d be curious whether your patterns look similar or completely different — write to me if you have. My sample is one verifier, 169 projects, mostly construction products in Europe. More datasets would make the picture sharper for everyone.
Related reading